Version française/French version: LINK
Sensitivity analyses allow you to assess the impact of variations in costs, development time, price, and sales volumes on your profitability and cash flow. Comparing your performance with that of your peers also enhances the credibility of your projections, particularly in terms of commercial efficiency

A business plan is rarely ballistic, and you may fail to achieve your economic and financial objectives due to numerous uncertainties related to your technology, market, competition, team, or simply the economic situation, as well as other events beyond your control.
That said, you may experience what the Swiss charmingly call “être déçu en bien”, i.e. “being pleasantly disappointed” or, in other words, pleasantly surprised. Some entrepreneurs exceed even their most optimistic scenarios. This was the case for the co-founders of the Big Mamma restaurant group, who didn’t anticipate such success, particularly with the opening of their Parisian restaurant La Felicità.
A financial sensitivity analysis allows you to measure the impact of key parameters on your income statement, financing plan, and monthly cash flow projections.
For example, you may find that your breakeven point is directly affected by changes in your fixed costs and margins on variable costs. By refining your forecasts, you can test different scenarios, ranging from the nominal plan to various alternatives.
Sensitivity Analysis: What Matters Most?
Even if you’re used to digesting large amounts of data, it’s better to visualize the impact of variations in parameters identified as critical. Graphs are often more insightful than tables of figures, in line with Confucius’s adage that ‘a picture is worth a thousand words.’
The parameters with the greatest impact on your business plan include:
- Development time for your offering: If it takes two years longer to develop an innovative project, your future cash flows will be heavily affected.
- The selling price of your main product or service: If you need to sell at a significantly lower price than expected, it will drag down your cash flow. Conversely, selling at a higher price can amplify your profits and cash flows.
- Your direct costs and other operating expenses: These will weigh on your margins and cash flow.
- Your actual sales volume: This can differ significantly from initial forecasts if you’ve misjudged your commercial efficiency or the size of your addressable market.
- Payment terms with clients and suppliers: These often-overlooked delays will impact your working capital requirements and operating cash flow.
Many other parameters can evolve in your favor or against you, depending on your industry and stage of development. It’s up to you to identify them.
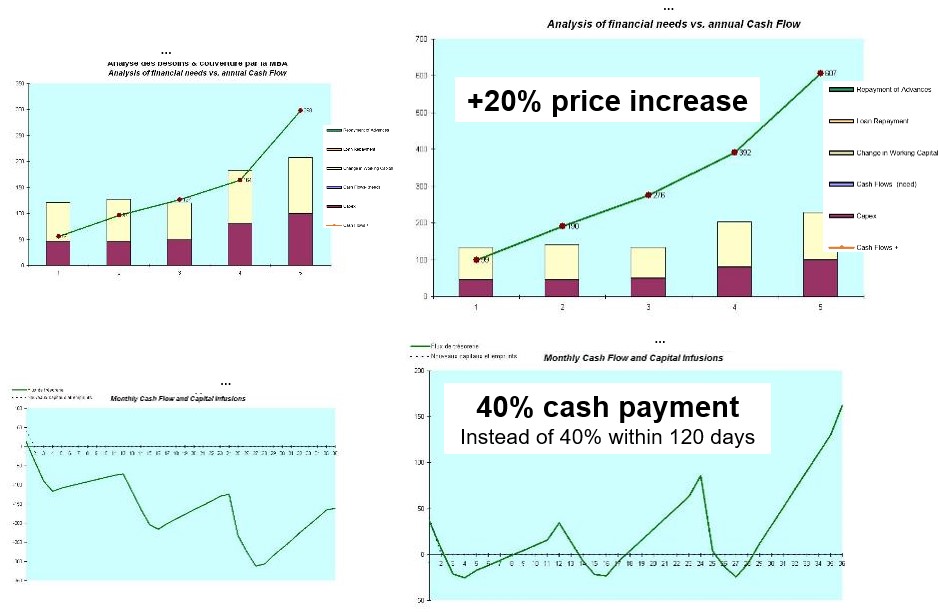
Impact of Selling Price and Payment Delays on Profits and Cash Flow
Compare Yourself to Your Peers
You can enhance the credibility of your financial projections by comparing your company’s key ratios with those of comparable companies and industry averages.
Strive to explain and justify any significant differences between your forecasts and these standards.
Benchmarking helps avoid overly optimistic forecasts that could undermine the credibility of your entire business plan. Such analysis is also required for initial public offerings.
Among the most critical benchmarks, evaluating your commercial efficiency is pivotal to achieving your forecasts. For instance, some companies triple their sales within 12 months while maintaining the same marketing and commercial budget. It’s crucial to justify the evolution of your Customer Acquisition Costs (CAC) and Customer Lifetime Value (CLV).
- The CAC measures what you need to spend to retain existing customers and acquire new ones. This ratio typically decreases over time, as retaining existing customers is less expensive than acquiring new ones.
- The CLV refers to the cumulative average margin a business earns from a given customer over time.
The breakeven point per customer, or ‘User Breakeven Ratio,’ is simple to calculate using these two ratios:
User Breakeven Ratio = CLV / CAC
This ratio, highly valued by professional investors, must quickly exceed 1 by a significant margin. When startups in their commercial phase that have raised millions fail, it often results from excessive customer acquisition costs. When ‘the sauce is more expensive than the fish,’ investors eventually give up.
What Is the Value of an Unquantified Strategy?
Let’s emphasize the iterative and collaborative nature of this process of benchmarking and sensitivity testing applied to financial modeling.
Creating financial forecasts requires phasing and balancing, as you need to identify key milestones and associated risks.
Beyond all the ratios, what ultimately defines your company’s value? It always comes back to your objectives, including potential valuation goals based on the exit horizon and the corresponding risk mitigation strategy.